Is this THE answer to all your data questions?!?! No probably not but was this my answer to how can I make data relevant to my classroom? To me? To my students???? It was my answer to why should students even care?!
Students should care about data that informs them of what they do and do not know about course concepts. Students need help in identifying the important information. They need difficult concepts connected to information they do understand so that bridges can be built over learning gaps. And I feel it is my job as their teacher to LEAD them in building their bridges – not DIRECT them. My connections may be different to theirs and that’s okay. What I want my students to know, understand, and remember is that I will be there to always support them, I was a student once, and this folder is in no way a “gotcha” activity. I started this out by developing the following lesson and corresponding assignment.
Lesson: Motivation
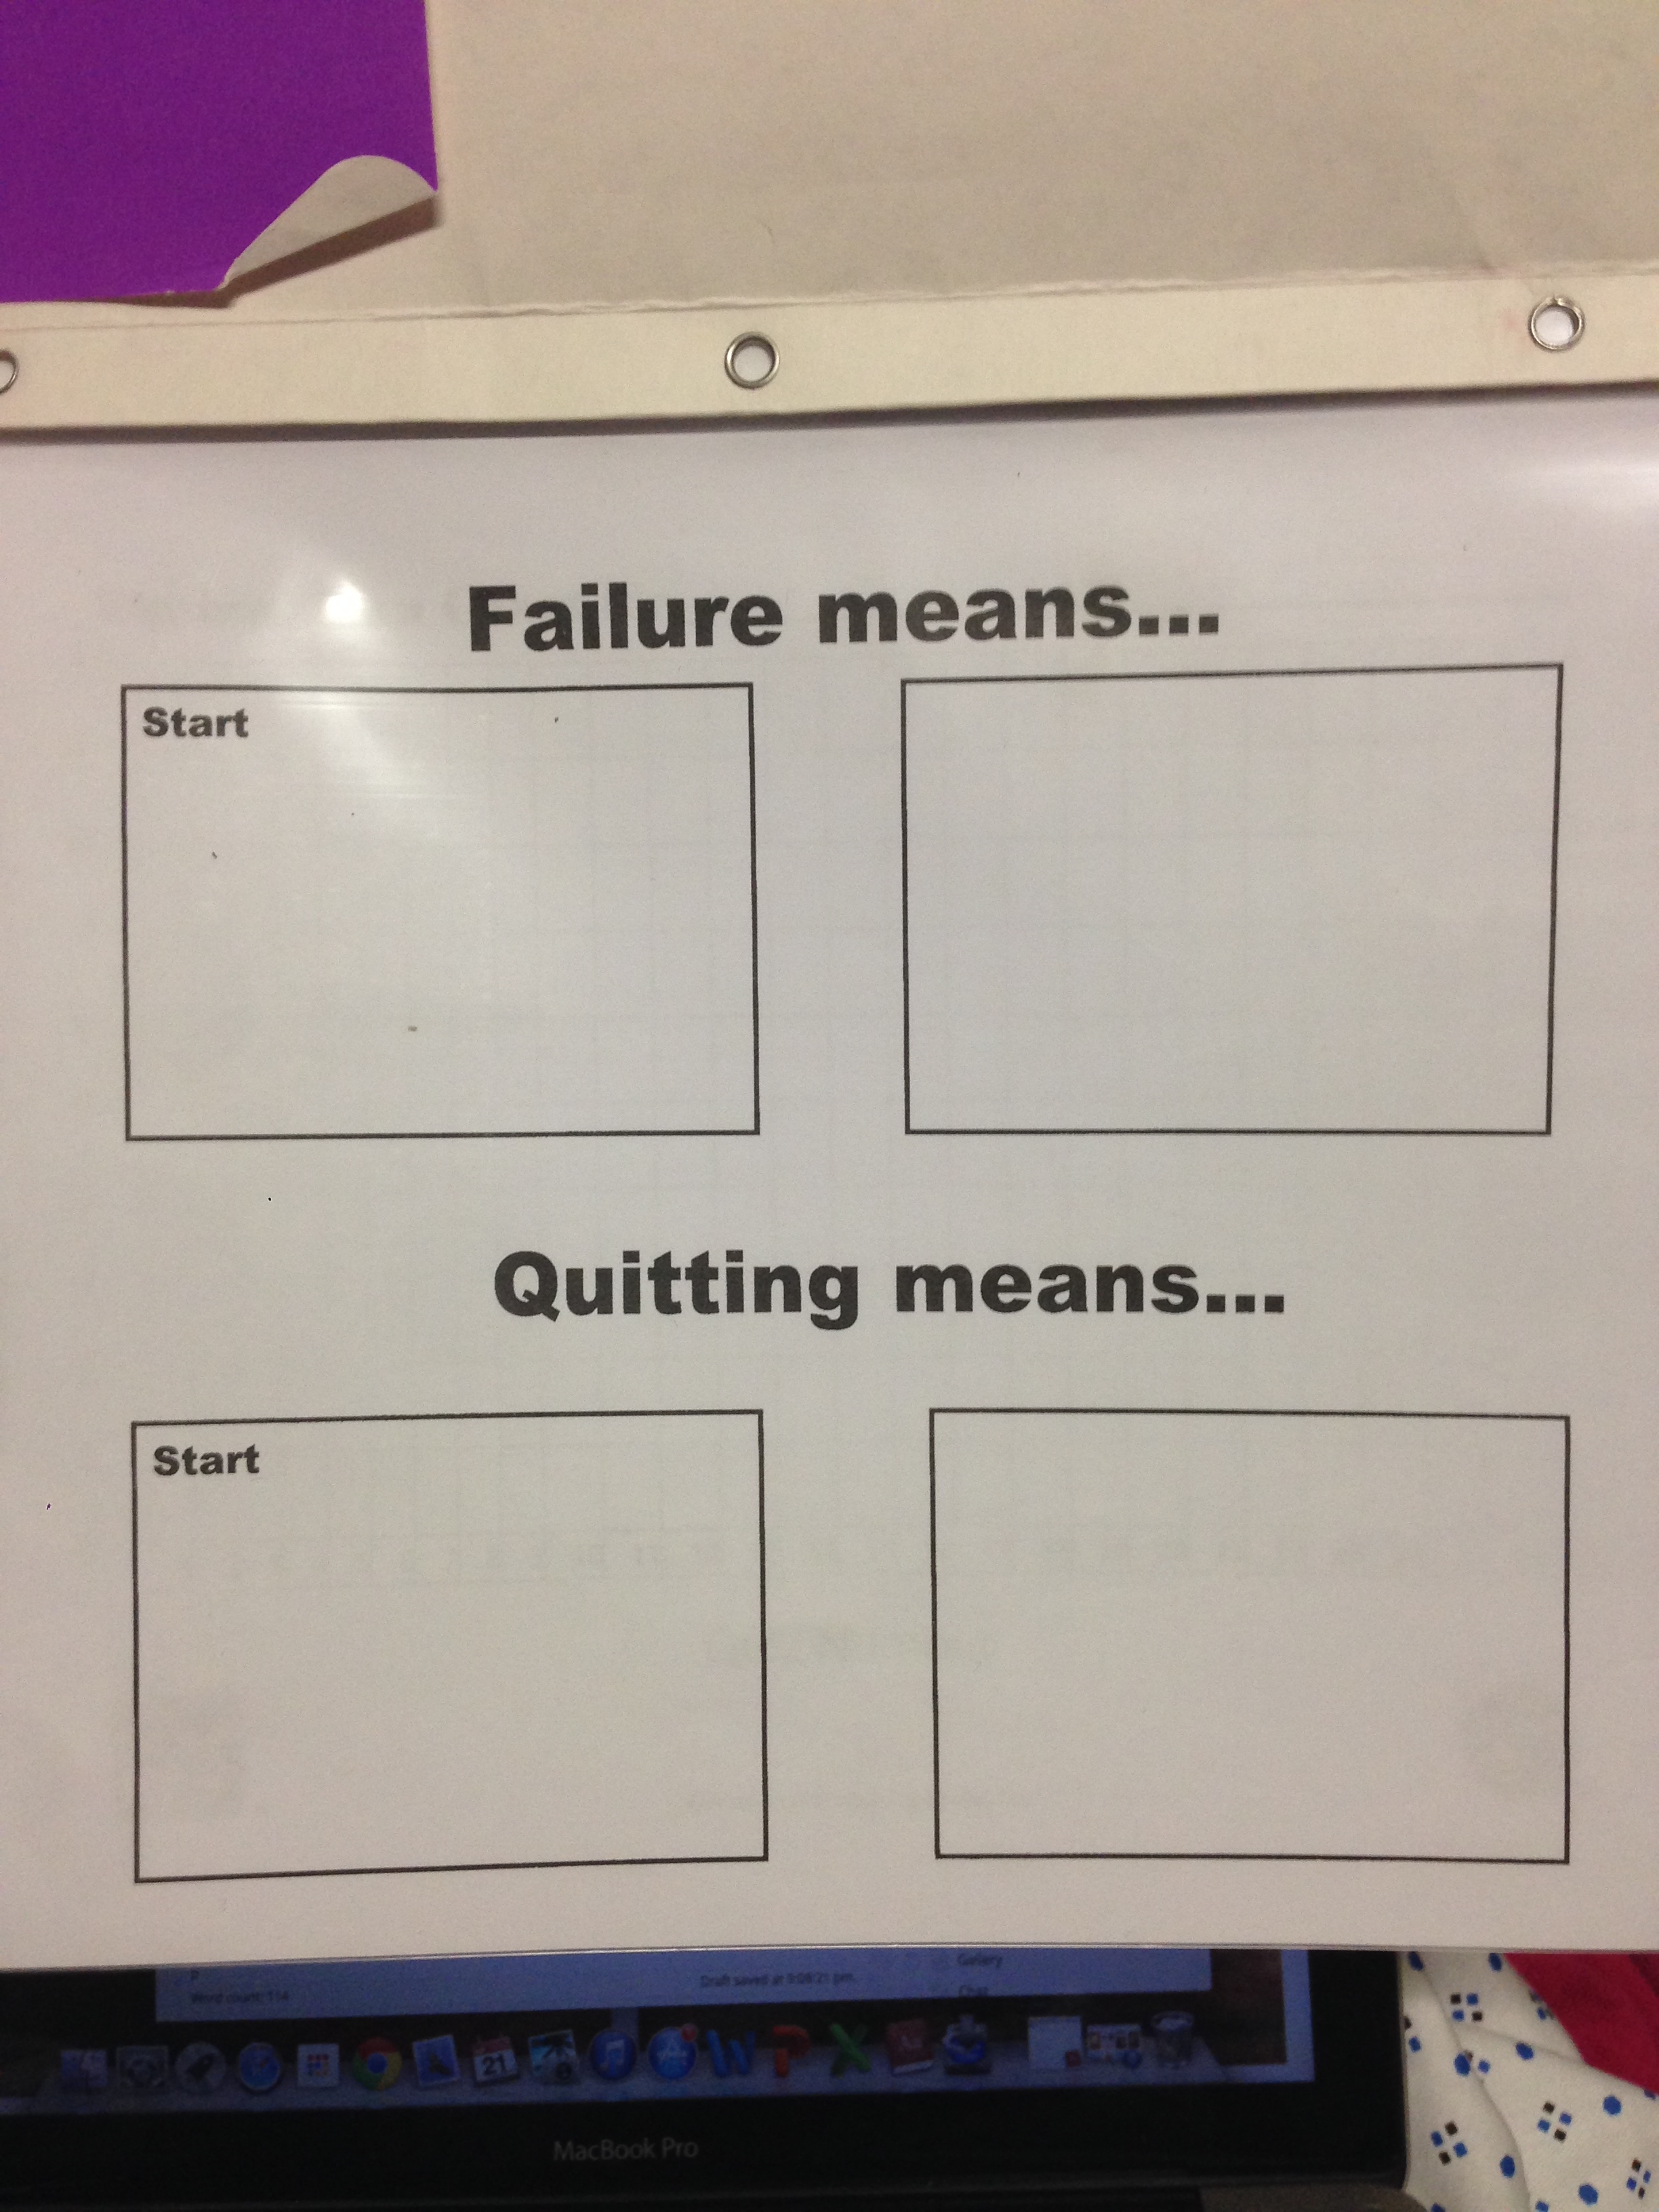
Failure, Quitting, and Making Mistakes Assignment
I think it worked out really well. Students slowly opened up about their initial feelings on how they defined the terms failure, quitting, and making mistakes. I made sure to include what those words meant to me when I was a student, what they meant to my parents, and how their differences effected my relationship with my parents. Once our discussion was over we watched clips about famous failures, a video about quitting titled “What If”, and famous mistakes. After the videos, I let the students make connections between our three original terms and the videos. I wanted them to include their new definitions in the other boxes and to keep this piece of paper at the front of their Student Data Folder. I wanted this to be their reminder that failing is okay, quitting is not, and making mistakes are the beginning pillars of success.
The next paper students included was this:

L to J Student Chart
This is an L to J Student Chart, developed by a man named Lee Jenkins, and built on the premise that students are not given permission to forget. I have chosen to use L to J Quizzes in my classroom designed around vocabulary for the semester. Students take weekly “quizzes” over the current semester terms. They get 10 questions each time and they may or may not have learned these terms yet. L to J focuses on terms they do get correct; we celebrate their successes! The goal is that towards the end of the semester they will see that the number of terms they get correct continue to increase – proving they are learning! I will take some updated photos of student charts as the semester moves along.
Next set of charts belong to:

Student Progress for All OASS Goals

Page 2 Student Progress for all OASS Goals
Students must be told what it is they are to learn! How else will they know?!? I provided a chart of all the new Oklahoma Academic Science Standards for Chemistry for each Student Data Folder. Once a standard is completed students will color in their understanding of that concept. How will they know their understanding? In comes the most important chart:

Student Progress Chart for Each Goal
This is a Student Progress Chart for Each Goal – Keeping Track of My (Student) Learning. This chart identifies the learning goal, learning scale, daily targets, and provides a graph for ALL formative/summative assessments with a legend. Students will also keep ALL assessments behind this progress chart so that come test time everything they will need is there!
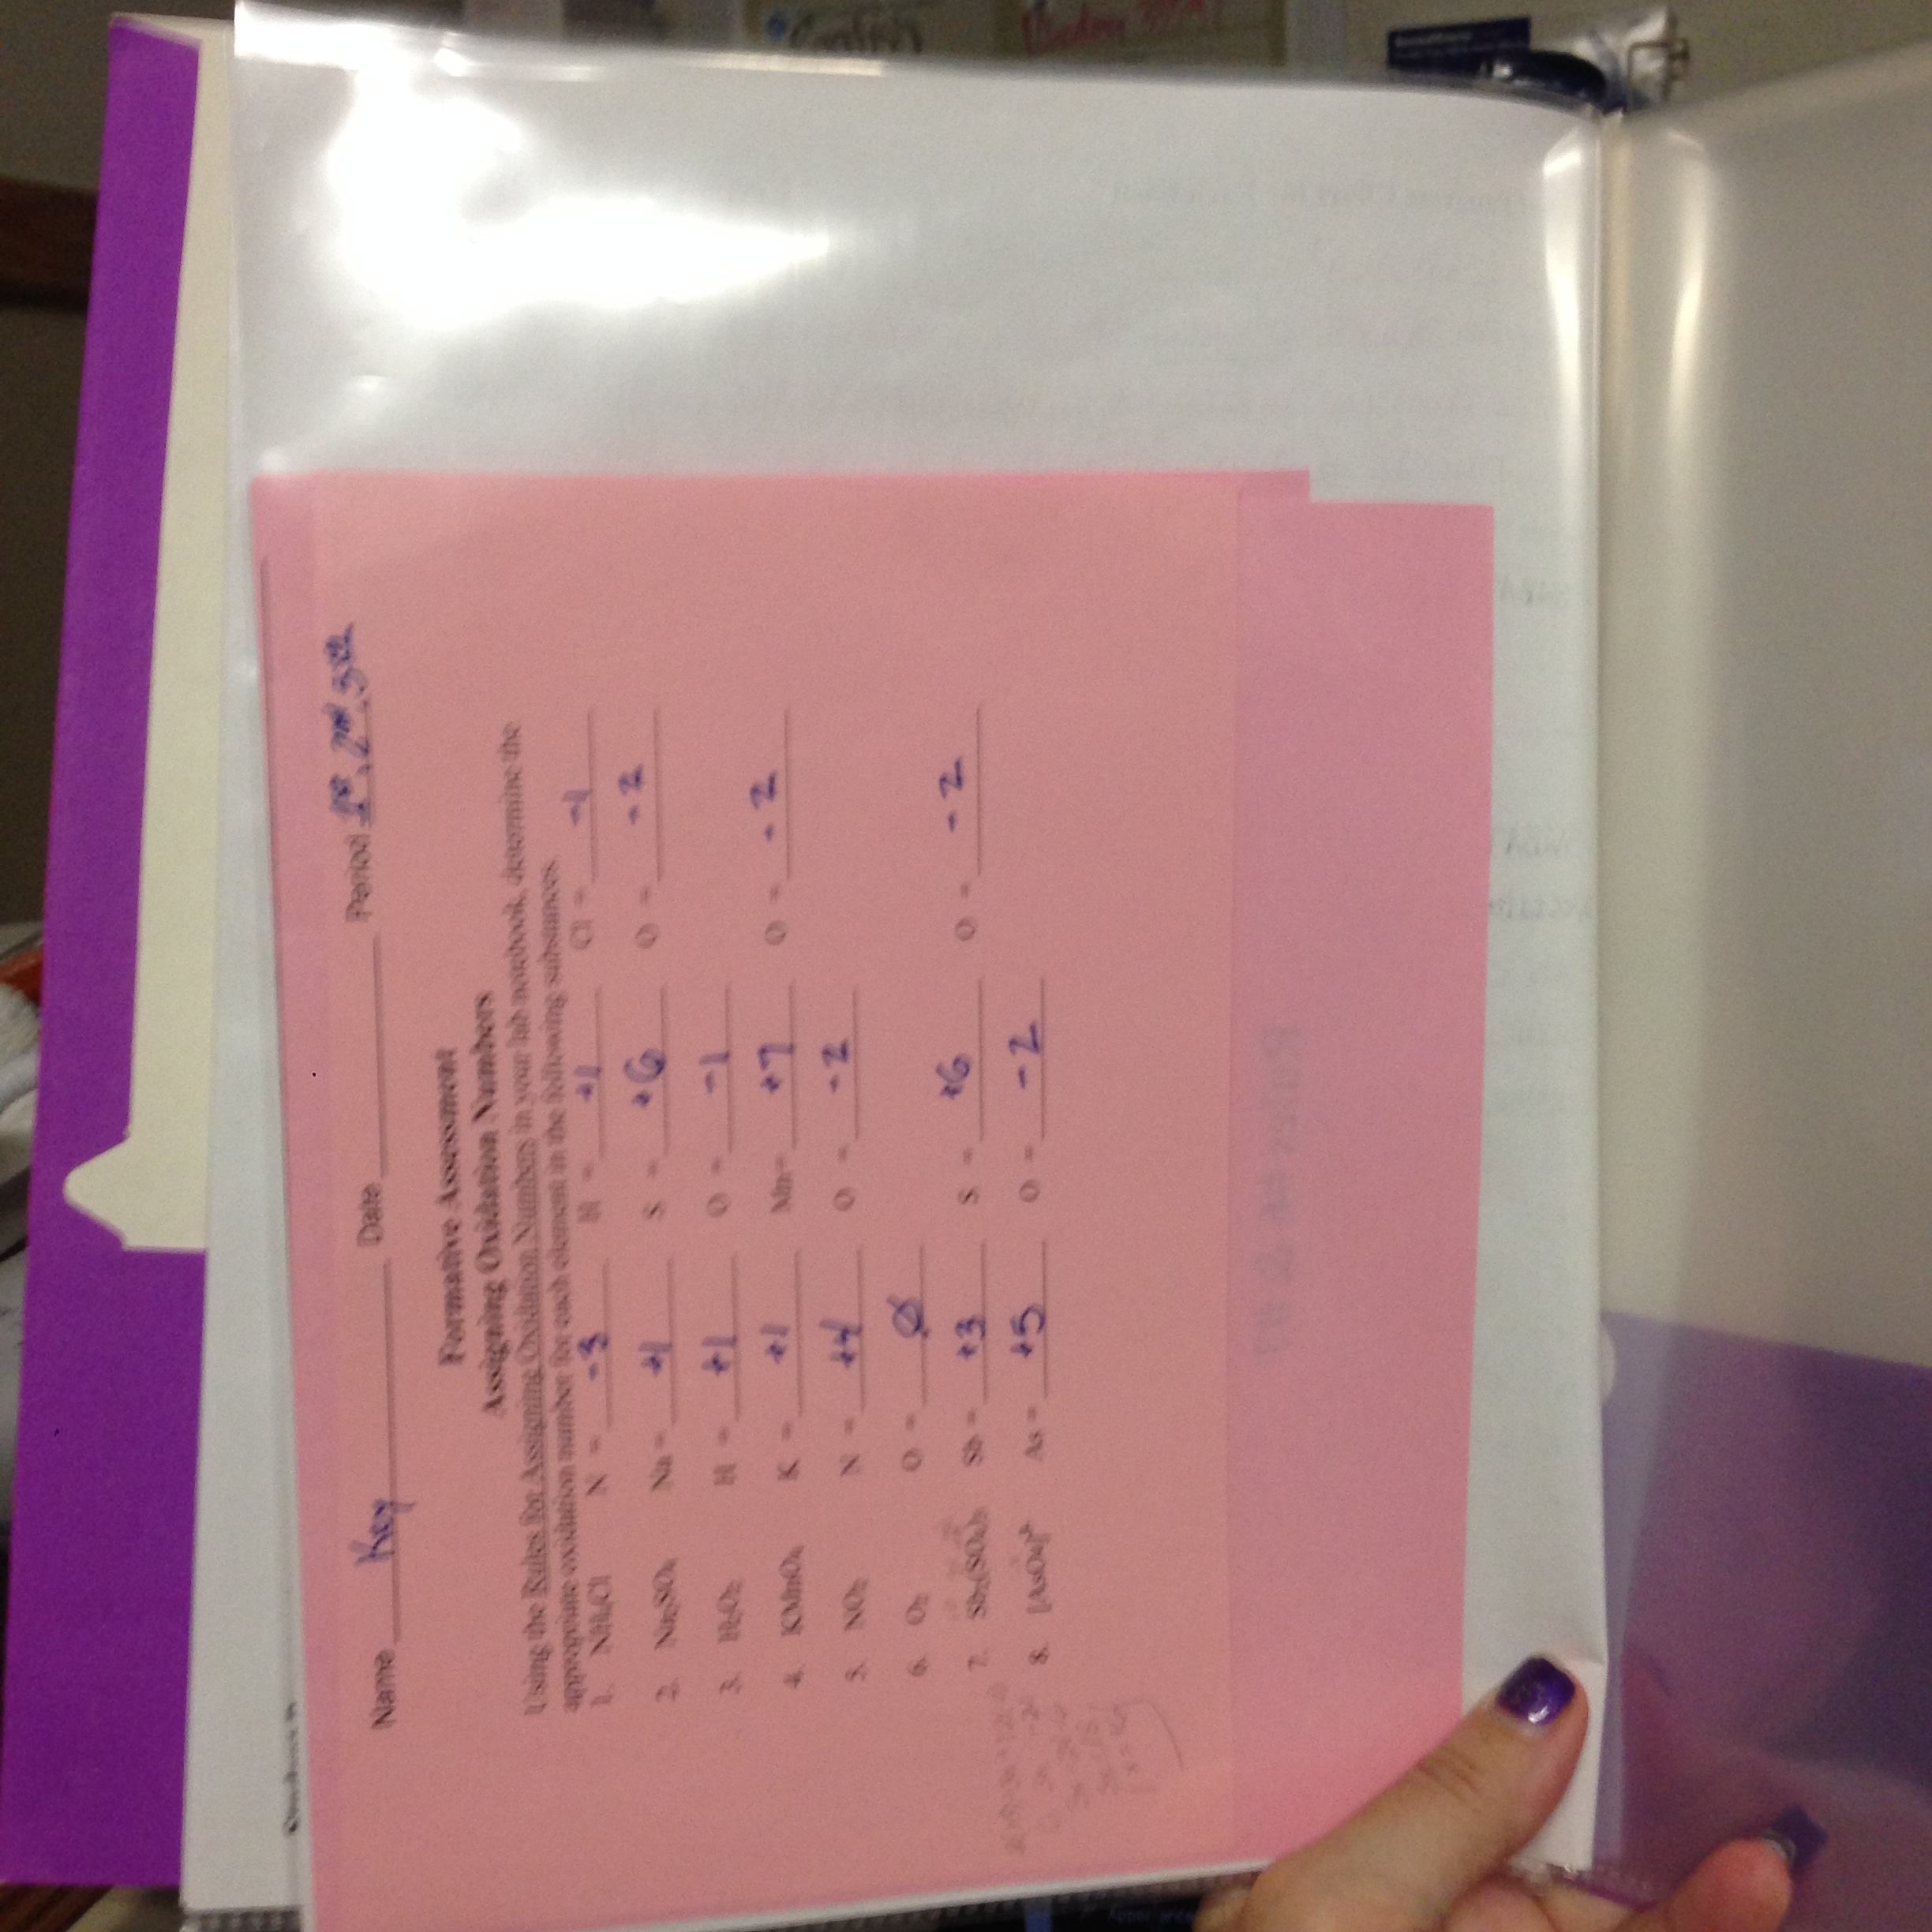
Student Formative/Summative Assessments for Learning Goal
I’m using group assignments, group discussions, 3D note-taking (foldables), mini-quizzes they grade, ticket’s to leave, and many other teaching techniques as assessments. The assessments measure only one part of the learning scale (the daily target), which has been throughly discussed so that students know exactly what I expect them to be able to do. The plan is that this will allow them to begin to work their way towards the learning goal (a level three, or a “B” on the scale) and hopefully to a level four (the A!)! Students will have one “test” that determines their level of understanding for that standard at the end of the lessons. The test asks students questions at each level of the learning scale and a final score is determined by the average. I will go into more details of this when my students take their first test! So far they seem to like the set up. They enjoy the mini-quizzes/questions at the end of each class and how I use them to start the beginning of the next class. Their questions are more specific which helps direct our conversations! Now I’ve missed more school due to my health so a test update may be a couple weeks away. In the meantime, I will make some posts more specific about my lessons and how I’ve developed the learning charts.
Hopefully I’ve raised some questions or helped bring to light some ideas you can use in your classroom! Feel free to emails me if you need to!


I was wondering where you heard about the L to J charts? In his book does it explain how to use them?
LikeLike
My District provided L to J professional development so I learned how to implement the charts from Lee Jenkins. I know he has several books that explain the process but I have not read one. I have looked into them and plan on reading his book called Improving Student Learning. It explains the philosophy and goes into more details about the L to J charts. I’m also going to write a post on how I use L to J in my room if you’re looking for more examples 🙂
LikeLike